
Nuestro análisis del impacto de las incertidumbres sobre la actividad económica muestra que nuevas tensiones podrían lastrar el crecimiento y retrasar la recuperación de la inversión (véase El impacto de las incertidumbres económicas sobre la inversión (groupama-am.com)). Sin embargo, cuando el nivel de incertidumbre ya es elevado, es más probable que disminuya que que siga aumentando. Por lo tanto, el principal riesgo a la baja de nuestro escenario no proviene de las incertidumbres relacionadas con el entorno político, geopolítico y comercial. En el marco del "balance de riesgos" de nuestro escenario económico, el principal factor bajista se encuentra en otro ámbito: la inestabilidad financiera y, en particular, los mercados bursátiles estadounidenses (véase la tabla Balance de riesgos en nuestro escenario económico para el otoño de 2024). Tras la fuerte subida de la renta variable estadounidense en 2024, impulsada por la temática de la inteligencia artificial, este factor de riesgo se ha reforzado lógicamente (véanse los Gráficos 1 y 2).
Vuelta a un Balance de Riesgos más "Equilibrado"
Positivos (+) | Negativos (-) |
|---|---|
|
|
Nota di lettura: Il bilancio dei rischi indica la direzione più probabile di una revisione delle nostre previsioni di crescita. Un bilancio dei rischi definito ormai "equilibrato" significa quindi che una revisione al rialzo delle previsioni di crescita è considerata altrettanto probabile quanto una revisione al ribasso.

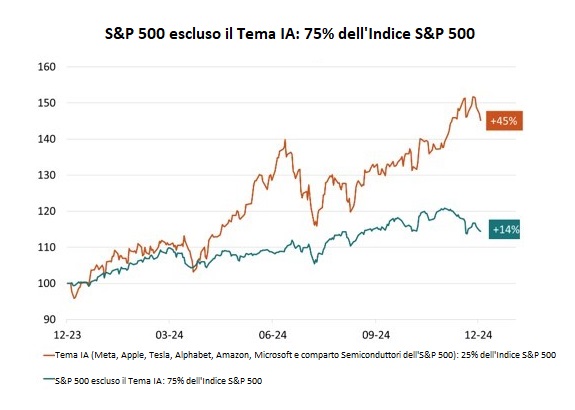
Fuente: Bloomberg – Cálculos: Groupama AM
The valuation diagnosis of stocks should not be based on a 'historical average,' which is rarely relevant. Just like the evaluation of bond yields, which is always compared to the current economic situation, stock analysis must also be made in light of the macroeconomic environment. This is why we have modeled the return on U.S. stocks (in fact, the inverse of the CAPE ratio, the cyclically-adjusted price-earnings ratio by R. Shiller) using five economic variables: interest rates, two cycle indicators (the unemployment rate and inflation), and two structural variables (productivity and demographics, with the proportion of 30-64-year-olds in the total population). Thus, the gap between the observed return and the 'theoretical' return serves as a measure of valuation that takes the economic regime into account.
Our statistical work shows that the rise in stocks in 2024 has brought U.S. stock returns into an 'abnormally low' zone considering the cyclical and structural situation (Graph 3). The current return is 'too low' compared to the theoretical return, which typically suggests a significant increase in dividends, potentially complemented by an adjustment in stock prices. According to the model used, the valuation gap is not of the same magnitude. However, all models show that this gap is now in an unprecedented zone since the late 1990s (Graphs 4 & 5).
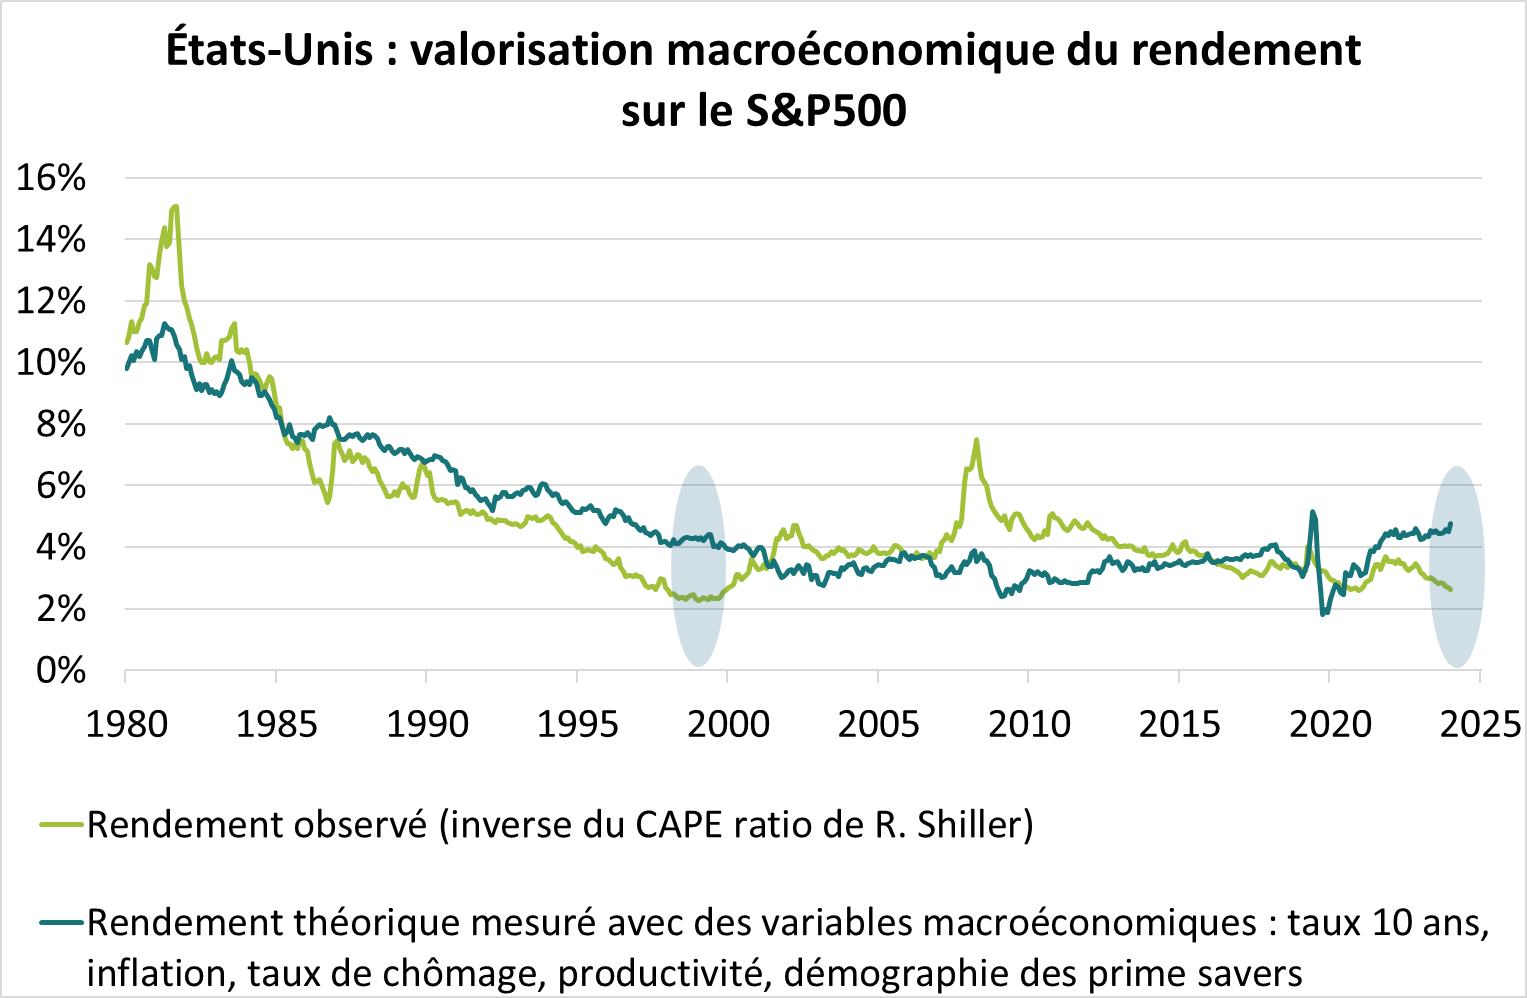
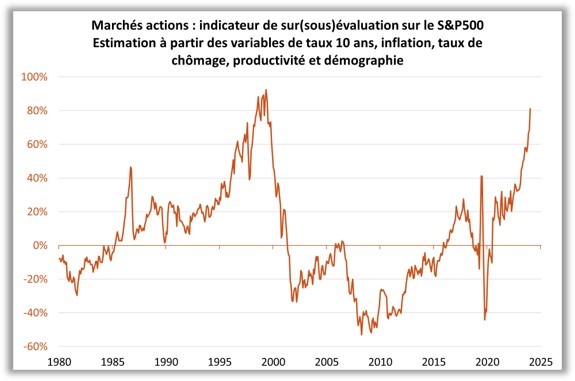
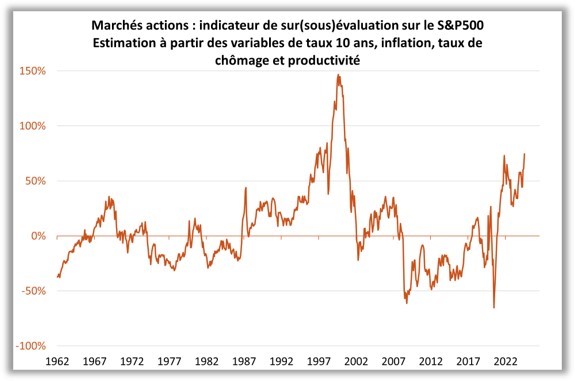
Fuente: Bloomberg – Cálculos: Groupama AM
In terms of financial investment, a valuation gap does not necessarily mean that a cautious strategy should be applied. It may make sense to follow the momentum, especially since it would be 'presumptuous' to predict when this risk will materialize. Our previous work on optimal strategy during periods of overvaluation has shown that caution can be costly if a market consolidation does not occur quickly, even in the case of excess. For example, a 'short' position in stocks taken in March 1999 (one year before the bursting of the bubble) would have underperformed a 'long' position until March 2001 (one year after the burst), until the gains of the 'long' position were entirely offset by those of the 'short' position.
On the other hand, from a macroeconomic perspective, our analysis leads us to avoid complacency: financial instability remains the primary downside risk in our scenario. At the very least, our scenario is contingent on not experiencing significant microeconomic disappointments in the 'AI galaxy' that could raise doubts about macroeconomic productivity gains. A correction in U.S. stocks would penalize consumption through the wealth effect and weigh on investment through a higher cost of capital. Many investors point to geopolitical and political risks, while sentiment on U.S. stocks has become largely positive (see Graph 6). Our risk hierarchy, therefore, differs from that of the Consensus.
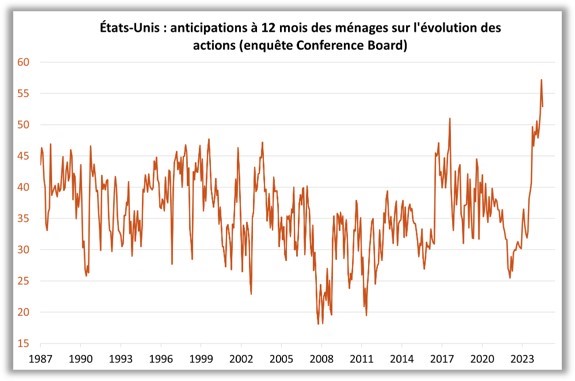
Source : Bloomberg – Calculs : Groupama AM
DISCLAIMER
This document is intended for informational purposes only.
Groupama Asset Management and its subsidiaries disclaim any liability in the event of alteration, distortion, or falsification of this document. Any unauthorized modification, use, or distribution, in whole or in part, in any form whatsoever is prohibited.
Before making any investment, investors must review the prospectus or the Key Investor Information Document (KIID) of the UCITS. These documents, along with other periodic reports, are available free of charge upon request from Groupama AM or at www.groupama-am.com.
This non-contractual document does not constitute a recommendation, a solicitation, or an offer to buy, sell, or trade, and should not be interpreted as such.
The sales teams of Groupama Asset Management and its subsidiaries are available to provide you with personalized recommendations.
Published by Groupama Asset Management – Registered office: 25 rue de la Ville l’Évêque, 75008 Paris – Website: www.groupama-am.com