
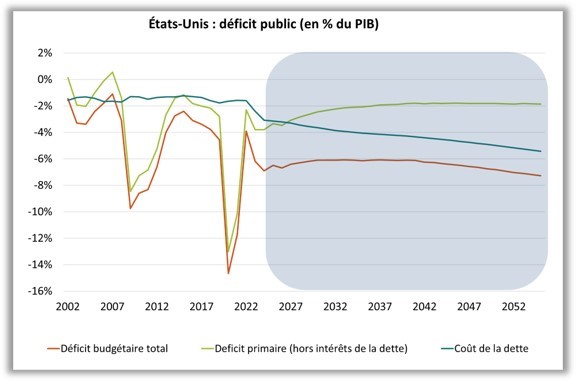
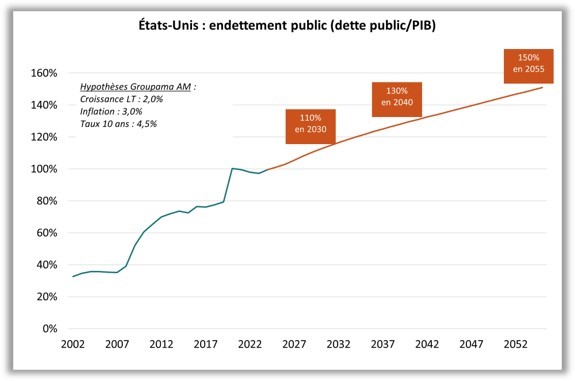
In the United States, even before discussions in Congress, the CBO1 estimated that the budget deficit would be between 6% and 8% over the next 30 years (orange curve on graph 1). This perspective does not come so much from the primary deficit, that is to say the deficit excluding interest on the debt (light green curve on graph 1), but largely from the repayment of interest (dark green curve on graph 1). With such a scenario, the trajectory of public debt is already inevitably upward, by 10 to 15 points of GDP per decade. Thus, the US public debt, which currently stands at 100% of GDP, should reach, according to us, 110% in 2030, 130% in 2040 and 150% in 2055 (graph 2).
Source: Bloomberg – Calculations: Groupama AM
Compared to this central scenario, all risks are oriented towards an even more degraded situation, and this for 3 reasons:
- Ongoing discussions in Congress are likely to increase the public deficit by 0.5% to 1% per year. Moreover, tax cuts are only extended until 2028 and it is very likely that they will be renewed beyond that, which will further worsen the budgetary situation.
- If financial markets doubt the sustainability of US public debt, this will raise interest rates and thereby the debt service.
- Finally and above all, the CBO's budget projections are very optimistic because they explicitly assume that there will be no growth shock over the next 30 years. In reality, the volatility of the deficit is almost entirely linked to cyclical budget slippages (orange curve on graph 1 over the past period).
What could then stabilize the debt?
- We calculated that by reducing the primary deficit from 3% to 0.5% of GDP, this would maintain the public debt ratio unchanged. However, such a tightening of fiscal policy seems, for the moment, politically impossible.
- We also estimated that the level of 10-year interest rates that would stabilize public debt is between 2.5% and 3% (the 10-year Treasury yield is currently around 4.5%). Therefore, the recourse to the "monetization" of the debt through purchases of Treasuries by the Fed ("QE", quantitative easing) seems inevitable. If the rise in long-term rates is constrained at some point by the reactivation of QE, the depreciation we expect on the dollar will therefore be even more pronounced to reflect the "country risk".
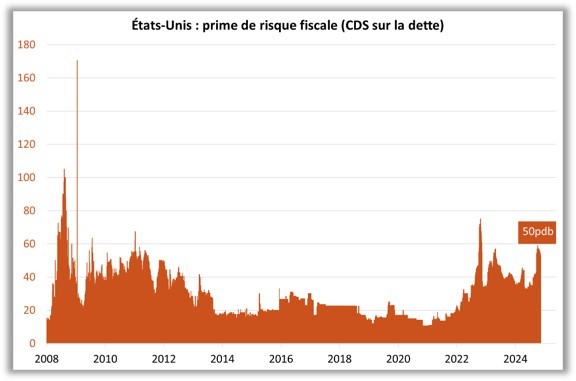
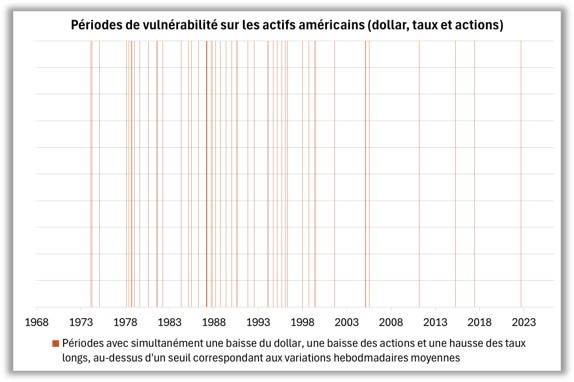
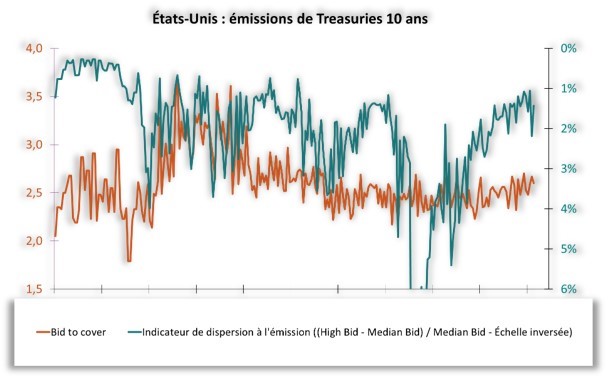
How to monitor fiscal risk in the United States? We consider that there are 3 indicators to measure US fiscal risk. First, there is the CDS on US sovereign debt, which currently stands at 50 basis points after a peak at almost 60 basis points in April (graph 3). Then, we monitor correlations in the markets. In particular, a significant drop in the dollar and stocks combined with a sharp rise in interest rates would be a signal, which has not been the case in the recent period (graph 4). Finally, it is necessary to monitor Treasury auctions in the primary market. At this stage, issues remain comfortably oversubscribed in terms of the bid-to-cover ratio (ratio between amounts requested and amounts issued), and without significant dispersion in the order book (graph 5). Thus, the markets have not yet tested the limit of the "exorbitant privilege" of the United States. Any further questioning of the rule of law in the United States will inevitably lead international investors to rebalance the weight of Treasuries in their bond portfolios.
Source: Bloomberg – Calculations: Groupama AM
1: the CBO (Congressional Budget Office) is an independent federal institution that evaluates US fiscal policy